
The Migration of our Workforce by Age Group
Workforce Migration Series: Article 2
August 27, 2019
In last week’s introductory article to our series about the migration of our workforce in Windsor-Essex, we raised several new questions important to setting the table on our project about talent attraction and retention in our region.
One of our key findings from the destination and origin dataset from the 2016 census, detailing the movement of workforce participants between different regions in Canada between 2011 and 2016, was that we experienced a net loss of workers under the age of 44, and a net gain of workers above the age of 44. For every 10 workers aged 44 and under that moved to our region from another part of Canada, 13 left. But for every 10 workers above the age of 44 who moved here from another of Canada, only 7 left.
While we know that since 2016, our region has been experiencing net gains in all age groups, we consider it important to understand what was behind our net gains and losses during the 2011-2016. Doing so will help us better understand our strengths and weaknesses as a region attracting and retaining talent in a way that prepares us for sustainable economic growth in the future.
In this article, we will seek to understand the dynamic of migration of age from a geographic perspective, finding out what regions young workers and older workers moved to and moved from.
WORKERS AGED 15 – 44: BETWEEN 2011 AND 2016, FOR EVERY 1 THAT MOVED FROM TORONTO TO WINDSOR-ESSEX, 2 LEFT
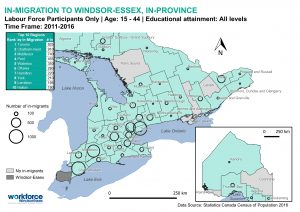
We’ll start with the movement of workers aged 44 and under. Workers of this age are more mobile than their older counterparts: 80% of all workers who moved into Windsor-Essex in this time fit into this category. They are also the age group that moved out of Windsor-Essex more than they moved into the region. So where did the movers come from, and where did Windsor-Essex residents of this age move to, and what insights can we distill from the patterns of their movement? See the maps below that illustrate the movement of this age group in and out of our region.
Where did younger workers come from?
Where did younger workers move to?

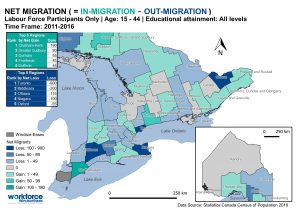
Overall, what regions did we gain or lose younger workers to?
At a glance, these maps are quite similar to those presented last week for the entire workforce: most movement in and out of our region took place between regions in the GTA, London, Chatham-Kent, and Ottawa. Many rural regions resulted in net gains of these workers for us, perhaps reflecting the desire of workers in these areas to access the broader job opportunities that exist in Windsor-Essex for an affordable cost of living.
However, there are a couple key differences that are noteworthy. One is that Toronto exhibits a net loss of 900 people in this period, which is more than the net loss of the aggregate population. In fact, by looking at the numbers in and out for Toronto, we can see that for every one worker aged 15-44 that moved from Toronto to Windsor-Essex, two workers moved in the opposite direction. We can see a similar pattern with Middlesex: a net loss of younger workers of 200, compared to a loss of 55 overall.
workers aged 45 +
The workforce aged 45 and older is a smaller portion of the mobile workforce, but it’s an important segment that Windsor-Essex actually succeeded with in the 2011-2016 period. The maps below can help us understand the nature of our success, and perhaps start thinking about how we can capitalize on it in the future. While workers of this age are closer to retirement, they can bring with them a wealth of experience that can have structural impacts on the industries that they work in.
Where did older workers come from?

Where did older workers move to?

Overall, what regions did we gain or lose workers to?
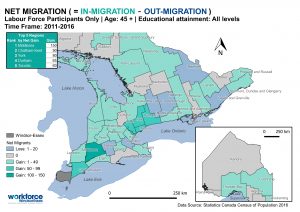
The patterns of what regions this segment of the population moves to and from continues to reflect the aggregate numbers, but the picture of net gains and losses is starkly different. While the younger working population shows significant losses with places like Toronto and Middlesex, the older working population actually shows net gains for these regions. The only areas that experienced net losses were all marginal: below 20 individuals. We believe this geographic pattern clearly indicates that what our region offers as far as affordability, job opportunities, and lifestyle appeals strongly to the older working population, especially workers from London and the GTA.
what can we learn by comparing these two sets of maps?
Seeing the geographic patterns of the movements of these two segments of the population is useful in itself, but perhaps even more insightful is looking at the contrasts between these patterns, namely those regarding migration to the City of Toronto and to Middlesex (London).
We discovered last week that in the aggregate, we experienced a net loss of over 800 workers to the City of Toronto between 2011-2016. By examining the patterns by these two broad age groups, we now see that this net loss is driven entirely by the migration of young people, and that older workers actually moved to Windsor-Essex from Toronto more than the other way around. What this means is that what we offered as a region appealed to urbanites who were older, but not as much to younger workers. This stresses the importance of understanding what they are looking for in selecting a place to live and work, which we suspect could be advancement opportunities, innovative work environments, and urban lifestyles. Our survey will help us in understanding this, as well as secondary research.
This difference might not only speak to a cultural divergence but also one about how career and lifestyle priorities change in life: whereas a younger worker prioritizes opportunities to advance and is therefore attracted to thicker labour markets, the same worker may prioritize things like community contribution and less fast-paced lifestyles once they are already established in their career, and would therefore be drawn to smaller urban areas like Windsor-Essex.
Last week, we saw that the movement of all workers between Windsor-Essex and Middlesex (London) was approximately equal in both directions. However, by doing an age-based analysis of workers this week, we now know that the mix of workers moving to our region from there is different from the mix of workers moving in the other direction: we experienced a net loss of younger workers, but a net gain of older workers. This dynamic might follow a similar logic to the one we noticed with Toronto.
Next steps
Our next Workforce Migration article will present a final set of maps illustrating the movement of workforce by educational attainment levels. Stay tuned for this article, and others that may follow.
The origin and destination dataset has been useful so far in understand the “what?” of migration patterns between our region and others in Ontario and beyond. However, it is limited in explaining the “why?”
That is why we are running a survey that we hope you and other people who live and work in Windsor-Essex, or have previously lived and worked in Windsor-Essex, will take. Why have you chosen the region? Have your say and help us make informed recommendations about talent attraction and retention in our region. Plus, there are great prizes to win in the prize draw. Please take the survey, and share the news with people you know.

Questions? Comments? Requests? Please get in touch at info@workforcewindsoressex.com!
Post by Julian Villafuerte, Project Coordinator and Researcher