Who is Moving Into and Out of Windsor-Essex?
Workforce Migration Series: Article 1
August 20, 2019
As featured in the Windsor Star
This year, Workforce WindsorEssex has embarked on a research project about talent attraction and retention in our region. We are aiming to answer questions such as: what is bringing workers to our region, who does our economy need to attract, and what innovative strategies will work to attract and retain the workers at both the employer and the regional level?
But first, we need to evaluate how we are doing by posing the following question: who are we already attracting to move and work in Windsor-Essex (and where did they come from), and who is leaving our region (and where did they go)?
This series, starting with this article, will cover our exploration of relevant data, literature, case studies, and current affairs as we build a picture of the current state of talent attraction and retention in our region. It will also follow our process in beginning to craft evidence-based strategy recommendations for the business community and local decision makers seeking to attract and retain talent in our region.
In today’s article, we reveal four key findings about overall trends in migration to our region, where workers are moving from and moving to, and the age and education level of workers moving into and out of our region.
overall, migration of all kinds has been on the rise in windsor-essex
According to both Annual Demographic Estimates and Taxfiler data, migration of all kinds has been on the rise since 2011. Below are two graphs that break down the overall increase or decrease to our region’s population through the net migration (number of people moving here minus the number of people that have left) of people by migration category and by age group.
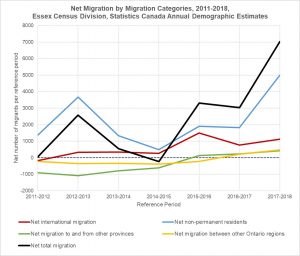
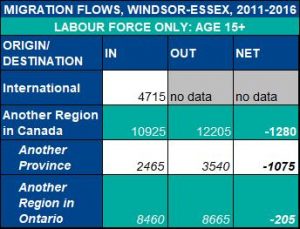
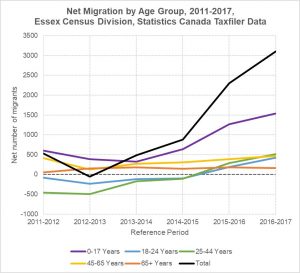 Both graphs indicate a promising upward trend of net migration for Windsor-Essex that appears to be driven by international migration and by migration of youth. An important development to highlight is that around 2016, net migration became positive for people aged 18-44 and for in-province and in-country movers. This is particularly important because migration between other regions within our province is the largest component of migration of our labour force: according to census data, between 2011 and 2016, 8,460 new workers in our region moved from other regions in Ontario, compared to 4,715 who moved from another country and 2,465 from another province.
In terms of regional talent attraction and retention, our ability to do well in the department of in-province migration is critical. To better understand our strengths and weaknesses with inter and intra-provincial migration, we analyzed a custom dataset from the census that includes the destination and origins of in-province movers between 2011 and 2016. The dataset also categorizes movers by labour force status, age group, and education level, so there are a lot of different ways to crunch the numbers and get useful information. Let’s cover the main findings first, focusing on the overall movement and composition of workers moving into and out of Windsor-Essex from other parts of the province and the country.
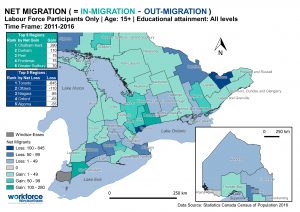
between 2011 and 2016, MOST IN-PROVINCE MIGRATION TO AND FROM WINDSOR-ESSEX HAPPENED BETWEEN CHATHAM-KENT, LONDON-MIDDLESEX, AND THE GTA. OVERALL, WE EXPERIENCED A NET LOSS OF 845 WORKERS TO THE CITY OF TORONTO.
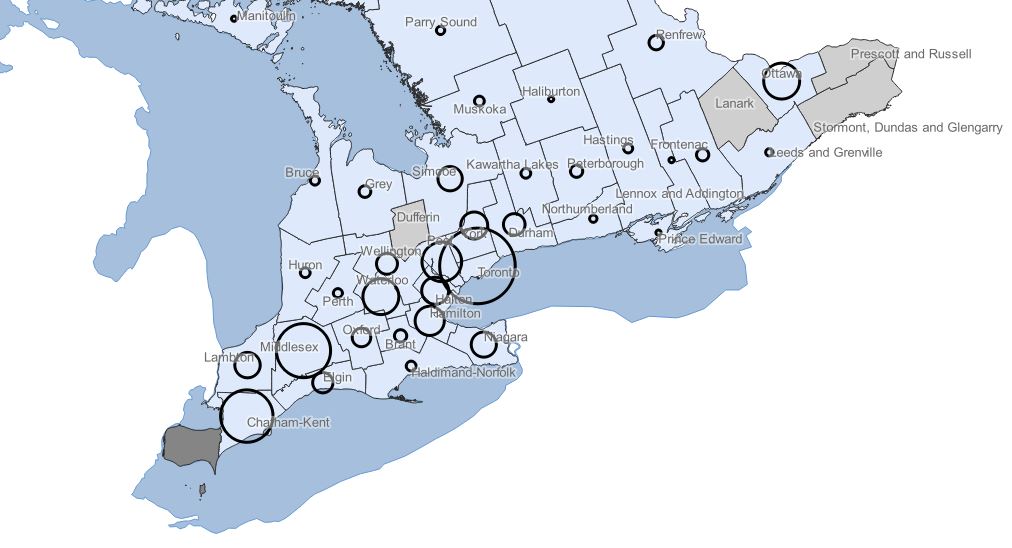
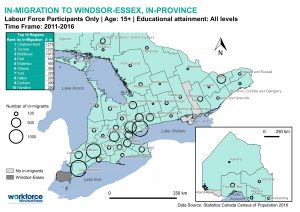
Let’s first take a look at the geographic patterns of in-province movement of the workforce into and out of Windsor-Essex between 2011-2016. Where did workers come from, where did they go, and what regions did we gain people from or lose people to overall? The maps below answer these questions in that order.
Where did new workers come from, within Ontario?
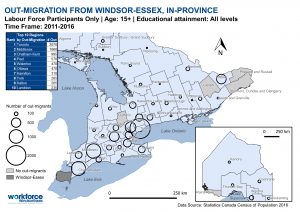
Where, within Ontario, did our workers move to?
What regions did we lose or gain workers from overall?
These visualizations of the destination and origin data provide us with a few key insights:
- Most migration of workers in and out of our region happened with regions nearby, like Chatham-Kent and Middlesex, and with regions within the Greater Toronto Area.
- Overall, we gained workers from smaller and more rural regions and from the suburban regions of the GTA.
- Overall, we lost workers overwhelmingly to Toronto, and to a more marginal degree to other urban centres including Ottawa, Niagara (St. Catherine’s), and Kitchener-Waterloo.
What can we conclude based on this information? On the attraction side, perhaps some of our strengths include the appeal of the lifestyle and affordability we offer, especially to people in Toronto and the surrounding area. While we experienced a large net loss to Toronto, it is important to note that the city was still our second largest source of new workers through in-province migration, after Chatham-Kent. This is something we could continue capitalizing on.
On the retention side, the loss of workers primarily to Toronto (24% of all in-province out-migrants) might indicate a broader and more global geographic trend of labour migration to larger population centres in the long-run. It might also point to the importance of providing the kind of amenities, lifestyles, and work-environments that are characteristic of large urban centres to retain a certain category of worker.
NET GAIN OF WORKERS ABOVE THE AGE OF 45, AND A NET LOSS OF WORKERS BELOW THE AGE OF 45
Looking at in-country movement of workers in and out of Windsor-Essex between 2011 and 2016, there is a clear pattern with respect to the age of the active labour force that moved in and out of our region: we succeeded in attracting an older workforce, and struggled in retaining our younger workforce.
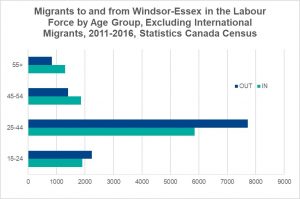
The above graph shows that more workers aged 45 and older moved to Windsor-Essex than left Windsor-Essex between 2011 and 2016, and that fewer workers aged 44 and younger moved to Windsor-Essex than left Windsor-Essex in that time frame. We particularly struggled with the 25-44 age group of workers: for every 10 people in that age group who moved here from another part of Canada between 2011 and 2016, 13 left.
Various factors could have contributed to this dynamic. Did we attract older workers due to the region’s appeal of safety, affordability, and retirement potential? Did we lose younger workers due to lack of real or perceived employment potential during this time frame, or a weaker cultural appeal compared to larger urban areas? In a future article, we will seek to answer these questions by looking at patterns in the origins of these generations and discussing how they conform to (or disagree with) prevailing ideas of Millennial and Gen Z attraction and retention.
NET LOSS OF WORKERS WITH A UNIVERSITY-LEVEL EDUCATION
The last view of this data that we will cover is the pattern it shows across workers based on their level of educational attainment, which reveals both good and bad news.
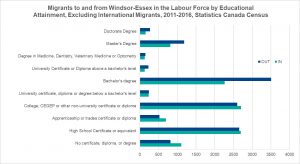
The good news presented above is that during the 2011-2016 time frame, we were able to attract more people with trades credentials than we lost, which is critical given our current labour shortage in that department. The bad news is that the number of workers leaving Windsor-Essex with a university education to other regions in Canada far surpassed the number of workers with that education level moving here from other regions in Canada. For every 2 workers with a university education who moved here from another part of Canada between 2011 and 2016, 3 left.
For us, this data raises several questions that we will begin to answer in our research. Are we facing brain-drain in Windsor-Essex? Where did we lose university-educated people to, and where could we attract more from? What impact does this trend have on our economy and our job market for all workers, and – if we need to – how could we mitigate it through retention strategies at both an employer and regional level?
final notes
This preliminary analysis of migration data highlights some of our strong points in attracting and retaining workers, such as our appeal to international migrants and to working people above the age of 45, and it highlights our weak points, which are primarily the following:
- Attraction and retention of working people between the ages of 25-44
- Attraction and retention of working people with a university-level education
- Competition for workers with Toronto
Certainly, overall migration figures have improved since 2011-2016, as has our local economy, which offers more jobs and a better median salary than it ever has. Times are better today than they were 5 years ago. But if we want to achieve sustainable economic growth that can reliably drive the quality of life upward in Windsor-Essex, we should seek to better understand workforce migration trends during this recent period of time, as they might be indicative of broader, macroeconomic and geographic trends that will define our future.
WHAT’S NEXT?
This early analysis raised many questions, some of which we can continue to answer using the same data set, and some of which we could answer by looking at case studies, by analysing the literature, and by talking to experts. We’re looking forward to sharing what we find in future posts articles, so stay tuned!
But for critically important questions, such as what our regional appeal is to different kinds of workers, why people move to Windsor-Essex, and why people leave, we will be relying on a survey, which we hope you and many other current and previous residents of Windsor-Essex will take. The more responses we get, the better recommendations we can make.

Questions? Comments? Requests? Please get in touch at info@workforcewindsoressex.com!
Post by Julian Villafuerte, Project Coordinator and Researcher